Code comparison between Django-pandas and pandas to get the same result
A pandas newbie (ME) tried to use pandas in django and didn’t know the difference between the two, so I looked it up.
For django-pandas
Django-pandas 0.6.4 supports Pandas (1.2.1)
Looks like you can use the latest pandas with django-pandas.
pip install django-pandashttps://github.com/chrisdev/django-pandas/
DataFrames can be easily created from Django QuerySets using the django-pandas.io module.
>>> from students.models import Lesson
>>> from django_pandas.io import read_frame
>>> lesson_data = Lesson.objects.all()
>>> df = read_frame(lesson_data, fieldnames=['student', 'course', 'teacher', 'textbook', 'page', 'score', 'comment', 'created', 'updated', 'completed'])
ForeignKey (course, teacher) also came up with clean data.
It seems that indexes can also be easily manipulated. In the case of the model above, for example, “course” can be changed to an index as follows.
lesson_data.to_dataframe(['student', 'teacher'......省略], index_col='course'])Using Pandas Dataframes with DataFrameManager
Add the following code to models.py
to_dataframeto_timeseriesto_pivot_table
Three methods are available
from django_pandas.managers import DataFrameManager #Add this

class Model (models.Model):

    ...

    ...

    objects = DataFrameManager() #Add this
Display specific elements
Display the “List of Lessons” and “Tutor Name” list of “Logged-in Students”.
def moreChart(request):
    current_user = request.user
    queryset = Lesson.objects.filter(student=current_user.id)
    df = read_frame(queryset, fieldnames=['student', 'course', 'teacher', 'textbook', 'page', 'score', 'comment', 'created', 'updated', 'completed'])
    teacher = df.teacher
    print(df)
    print(teacher)
I can easily take it out element by element, so I’ll try to visualize this (I already have a list using Bootstrap, so I want to make a pie chart by instructor in charge and by text)
For pandas
This time, views.py is narrowed down to the data of “logged-in users” and returns both “values()” and “values_list()” for comparison.
import pandas as pd

def moreChart(request):
    current_user = request.user
    queryset = Lesson.objects.filter(student=current_user.id).values()
    queryset2 = Lesson.objects.filter(student=current_user.id).values_list()
    data = pd.DataFrame(queryset)
    data2 = pd.DataFrame(queryset2)
    print(data)
    print(data2)

    return render(request, 'students/djangopandas.html', {
        'data': data,
        'data2': data2
    })

values(): column names are displayed
values_list(): Since the column names are numeric, values() seems better in this case.
Will the “teacher name/course name” in the ForeignKey become “teacher_id” or “course_id”?
Organize views.py and display html
def moreChart(request):
    current_user = request.user
    queryset = Lesson.objects.filter(student=current_user.id).values()
    data = pd.DataFrame(queryset)
    print(data)

    return render(request, 'students/djangopandas.html', {
        'data': data.to_html(), #Add this
    })
{% extends "students/base.html" %}
{% block title %} My Chart {% endblock %}
{% block body %}
<div class="container">
{{ data | safe }} # Add "| safe" after "data" to align
</div>
{% endblock %}Add “safe” to add a ruled line

Only the student with “id-2” who is currently logged in is displayed.
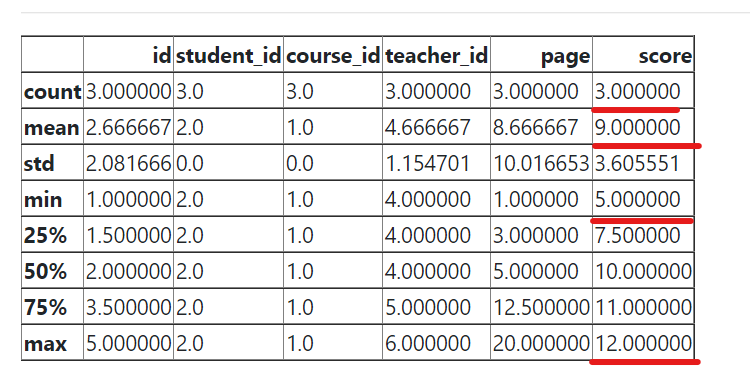
I’ll add a “describe” and add up the total (only the score is useful this time…).
def moreChart(request):
    current_user = request.user
    queryset = Lesson.objects.filter(student=current_user.id).values()
    data = pd.DataFrame(queryset)


    return render(request, 'students/djangopandas.html', {
        'data': data.to_html(),
        'describe': data.describe().to_html() # Add this
    })
{% extends "students/base.html" %}

{% block title %} My Chart {% endblock %}


{% block body %}
<div class="container">
    {{ data | safe }}
    <hr>
    {{ describe | safe }}  # Add this
</div>
{% endblock %}
It kind of did a lot of calculations (laughs).
It looks great when used for sales management and inventory control.
From the top of the red line, “Score Appearance: 3 times”, “Average: 9 points”, “Minimum: 5 points”, and “Maximum: 12 points”.

Focused data display on specific elements
Display of the list of “Logged-in students” lessons and the name of the instructor in charge.
def moreChart(request):
    current_user = request.user
    queryset = Lesson.objects.filter(student=current_user.id)
    df = read_frame(queryset, fieldnames=['student', 'course', 'teacher', 'textbook', 'page', 'score', 'comment', 'created', 'updated', 'completed'])
    teacher = df['teacher']

    return render(request, 'students/djangopandas.html', {
        'df': df,
        'teacher': teacher
    })
Extracting specific elements in pandas
Convert to dictionary type
    data2 = data.to_dict()
    print(data2)
I changed the “data” from the previous example to a dictionary type. A dictionary is generated for each column.

Let’s extract only “comment”
print(data2['comment'])
Displays a list of “textbooks” used in lessons by logged-in users.
def moreChart(request):
    ”””中略”””
    textbooks = data['textbook'].to_list()


    return render(request, 'students/djangopandas.html', {
        'data': data.to_html(),
        'describe': data.describe().to_html(),
        'textbooks': textbooks
    })
{% extends "students/base.html" %}
{% block title %} My Chart {% endblock %}
{% block body %}
<div class="container">
{{ data | safe }}
<hr>
{{ describe | safe }}
<hr>
{{ textbooks }}
</div>
{% endblock %}Below the “describe” text, you can see a list of the texts (Chart-1) that the student used in the lesson.

Summary of this topic
As a beginner, I am grateful for django-pandas, which could easily display ForeignKey (name of instructor/course). how can I display the name of ForeignKey (currently id display) in pandas as well? The learning continues…


